1. Monitors #
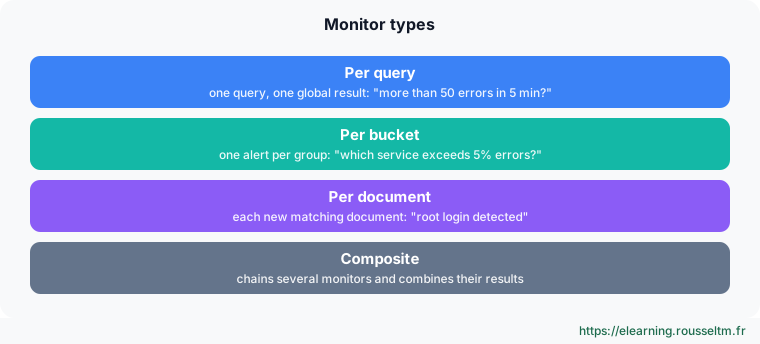
Four ways to monitor.
Types #
Good to know : Requests are written in the OpenSearch Dashboards Dev Tools console format (GET _cluster/health). On the command line, the same request iscurl -sk -u 'admin:Str0ng!Passw0rd-2026' https://localhost:9200/_cluster/health, with-H 'Content-Type: application/json' -d '…'when there is a body.
The alert chain #
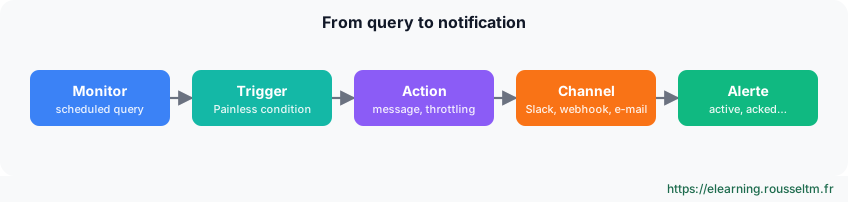
| Alert state | Meaning |
|---|---|
| Active | the condition is true, actions run |
| Acknowledged | someone is on it: no more notifications |
| Completed | the condition is false again |
| Error | the monitor query failed |
2. Notifications #
One channel, several monitors.
Creating a channel #
POST _plugins/_notifications/configs
{
  "config_id": "slack-sre",
  "config": {
    "name": "Slack SRE",
    "description": "Canal #alertes-sre",
    "config_type": "slack",
    "is_enabled": true,
    "slack": {"url": "https://hooks.slack.com/services/…"}
  }
}

POST _plugins/_notifications/feature/test/slack-sre| Type | Use |
|---|---|
| slack, chime, microsoft_teams | team chat |
| webhook | any HTTP tool: PagerDuty, Opsgenie, ticketing |
| smtp_account + email | email through an SMTP server |
| sns | Amazon SNS |
3. A per-group monitor #
One alert per struggling service.
Bucket-level monitor #
POST _plugins/_alerting/monitors
{
  "type": "monitor",
  "monitor_type": "bucket_level_monitor",
  "name": "taux_erreur_par_service",
  "enabled": true,
  "schedule": {"period": {"interval": 5, "unit": "MINUTES"}},
  "inputs": [{
    "search": {
      "indices": ["logs-app-*"],
      "query": {
        "size": 0,
        "query": {"range": {"@timestamp": {"gte": "{{period_end}}||-5m", "lte": "{{period_end}}", "format": "epoch_millis"}}},
        "aggregations": {
          "composite_agg": {
            "composite": {"sources": [{"service": {"terms": {"field": "service"}}}]},
            "aggs": {"erreurs": {"filter": {"term": {"level": "ERROR"}}}}
          }
        }
      }
    }
  }],
  "triggers": [{
    "bucket_level_trigger": {
      "name": "plus_de_5_pourcent",
      "severity": "2",
      "condition": {
        "buckets_path": {"total": "_count", "erreurs": "erreurs._count"},
        "parent_bucket_path": "composite_agg",
        "script": {"source": "params.total > 20 && params.erreurs / params.total > 0.05", "lang": "painless"}
      },
      "actions": [{
        "name": "slack",
        "destination_id": "slack-sre",
        "message_template": {"source": "Taux d'erreur élevé : {{#ctx.newAlerts}}{{bucket_keys}} {{/ctx.newAlerts}}"},
        "action_execution_policy": {"action_execution_scope": {"per_alert": {"actionable_alerts": ["NEW", "DEDUPED"]}}},
        "throttle_enabled": true,
        "throttle": {"value": 30, "unit": "MINUTES"}
      }]
    }
  }]
}
The params.total > 20 threshold avoids alerting on 1 error out of 2 requests at night. Throttling sends only one message per alert every 30 minutes.
Best practice : Test a monitor before enabling it: POST _plugins/_alerting/monitors/<id>/_execute?dryrun=true runs the query and trigger without notifying.Per-document monitor #
The doc_level_monitor evaluates each new document with simple queries (field:value): ideal for security ("root login", "blocklisted IP"), as no occurrence gets lost in a count.
4. Anomaly detection #
When you do not know the right threshold.
Principle #
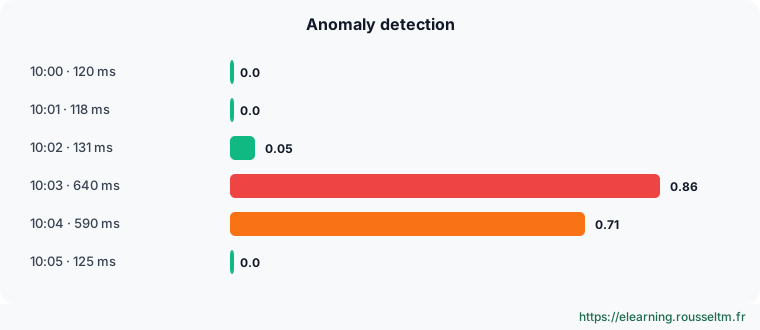
The Anomaly Detection plugin learns the normal behaviour of one or more measures with the Random Cut Forest algorithm, continuously. Each interval gets a grade (anomaly grade, 0 to 1) and a confidence. It needs a few dozen intervals of history before the first results.
Creating a detector #
POST _plugins/_anomaly_detection/detectors
{
  "name": "latence_paiement",
  "description": "Latence moyenne du service paiement",
  "time_field": "@timestamp",
  "indices": ["logs-app-*"],
  "filter_query": {"term": {"service": "paiement"}},
  "feature_attributes": [{
    "feature_name": "latence_moyenne",
    "feature_enabled": true,
    "aggregation_query": {"latence_moyenne": {"avg": {"field": "duree_ms"}}}
  }],
  "detection_interval": {"period": {"interval": 1, "unit": "Minutes"}},
  "window_delay": {"period": {"interval": 1, "unit": "Minutes"}}
}

POST _plugins/_anomaly_detection/detectors/<detector_id>/_start
Add category_field (for example ["service"]) for one model per service: a single detector then watches each entity separately. An alert monitor can then hook onto the detector results.
Security Analytics #
Security Analytics applies Sigma detection rules (over 2,000 rules provided) to typed security logs: Windows, network, DNS, CloudTrail, etc. Matches produce findings, correlated across sources, and can trigger alerts.
Commands to know #
Commands to know
POST _plugins/_alerting/monitors/<id>/_execute?dryrun=true: test a monitorGET _plugins/_alerting/monitors/alerts: current alertsPOST _plugins/_notifications/feature/test/<config_id>: test a channelPOST _plugins/_anomaly_detection/detectors/<id>/_start: start a detectorPOST _plugins/_anomaly_detection/detectors/results/_search: anomaly results
Sources #
Checked in November 2026 (OpenSearch 3.x, Data Prepper 2.x): OpenSearch ships a minor release about every six weeks, check the release notes before relying on a detail.