1. LogHouse: ClickHouse monitors ClickHouse Cloud #
The founding case.
Key points #
To monitor its own cloud service, ClickHouse projected a Datadog bill of $26M per month at list price (30-day retention, at 19 PiB). The internal LogHouse platform, built on ClickHouse, is at least 200 times cheaper at list price; migrating logs took 1.5 engineers under three months. It now exceeds 200 PB of telemetry across more than 30 regions.
The lesson: at very high volume, observability cost depends first on the storage engine, not the UI.
2. Qonto: traces serving delivery and incidents #
A neobank, its traces and its automations.
The architecture #
- Traces (back end, front end, Kubernetes, tools like GitHub) go through OpenTelemetry collectors, over HTTP or gRPC, to ClickHouse Cloud, with the conventional OpenTelemetry schema.
- Columnar storage gives them a compression ratio of about 26 on traces.
- Compute is separated: a write service for collectors, a read service for Grafana and analysis tools, a “critical” read service reserved for automations.
Three automations #
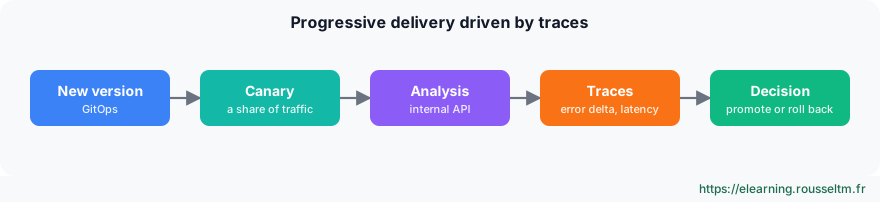
| Automation | How it works |
|---|---|
| Canary analysis | for each new version, a progressive delivery analysis template queries an internal API computing the canary version's error delta and latency on traces; the version is only promoted if the success condition holds |
| Status page | an availability API checks every 30 seconds, on traces, the share of successful and fast enough requests for each key feature, with “degraded” and “down” thresholds; the public status page (open source kener tool) is built from these results |
| Remediation | an incident management API relies on these checks to trigger an automatic rollback |
Good to know : Limit identified by the team: their availability is computed in time slices (time-based SLO). The announced next step is an event-based SLO, with the SLI set on each span in a dedicated column. See the article “Time-based vs event-based SLO”.
Takeaways #
- Traces are not only for investigating: they are data for deciding (promote, roll back, publish a status).
- Reserve dedicated compute for automations, so a dashboard query never delays a delivery decision.
- Describe checks as declarative configuration (service, filters, success condition, thresholds), versioned with the code.
3. Ringover: full control, full responsibility #
A self-hosted platform.
The context #
Ringover (telephony and customer conversations) runs its own infrastructure, in Europe and the United States: over 500 physical nodes. Its observability is therefore self-hosted: “freedom to choose the parts, and the duty to run them”. ClickHouse was chosen after trials on real workloads (first Jaeger traces, user analytics), not from a benchmark; it reaches a compression ratio of about 16.
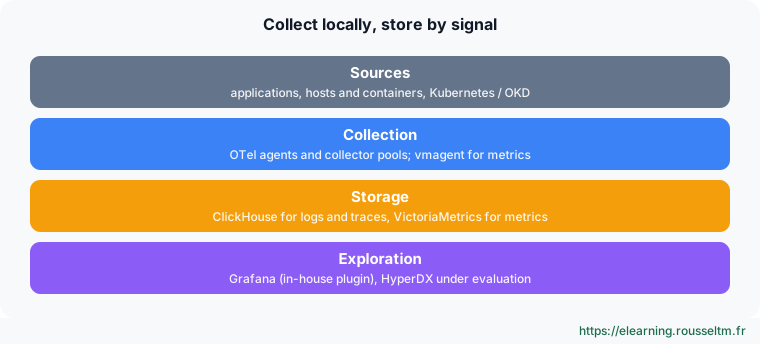
Before: central Prometheus, Vector and Loki for logs, a fleet that doubled in two years. After: local agents and push pipelines, ClickHouse for logs and traces, VictoriaMetrics for metrics. “Not a database swap: a new collection and operating model.”
Their lessons #
| Topic | Lesson |
|---|---|
| Ingestion | batch deliberately: batches of about 80,000 rows, 5 to 10 s window, persistent queues per signal |
| Schema | moving from Map to JSON made searches and filters 3 to 4 times faster, but long retention imposed long dual writes |
| Queries | dashboards, MCP queries and dual writes compete for resources: limit parallelism, concurrency and duration, size caches |
| Retention | 180 days of logs, 30 on local SSD; cold data on S3 is cheap to store, not to read |
| Developer experience | when the UX is missing, you build it (in-house Grafana plugin) and then maintain it; HyperDX is under evaluation, with IAM still to solve |
“If we started tomorrow” #
- Batch upstream: batches of 10,000 to 100,000 rows in the collector, one queue per signal.
- Fence queries: a dedicated query profile, ingestion keeps priority.
- Choose the schema early: adopt JSON attributes before retention makes migrations long.
- And plan developer experience and access management from day one.
“The work did not disappear: it became ours.” Self-hosting brings control over capacity and tuning, at the cost of running ingestion, upgrades, retention and access.
4. Summary #
Three models, one engine.
Comparing #
| LogHouse | Qonto | Ringover | |
|---|---|---|---|
| Model | vendor's internal platform | ClickHouse Cloud | self-hosted on bare metal |
| Signals | logs (then all signals) | traces first | logs and traces; metrics in VictoriaMetrics |
| Strength | cost at very high volume | trace-driven automations | full control |
| Effort | short migration | internal APIs to maintain | full operations to own |
Sources #
Talks by LogHouse (ClickHouse), Qonto and Ringover at the ClickHouse Observability Morning, Paris, 17 November 2026; LogHouse figures published on the ClickHouse blog. Companies' internal details are only described at the level of principles.
