1. One console, three signals #
What OpenSearch offers.
Overview #
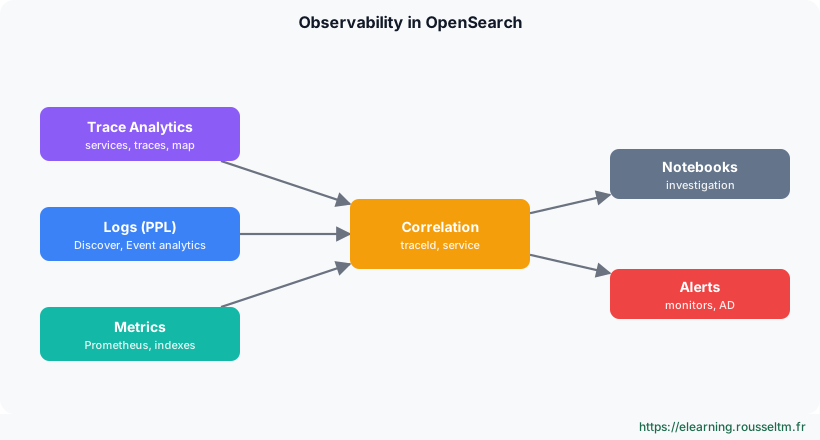
| Signal | Ingestion | Use |
|---|---|---|
| Traces | OTLP → Data Prepper (otel_traces) | Trace Analytics: services, latencies, errors, map |
| Logs | Fluent Bit, OTel, Data Prepper | Discover, PPL, patterns |
| Metrics | OTel indexes or external Prometheus source | PromQL or PPL, visualizations |
2. Trace Analytics #
Following a request end to end.
The views #
- Services: per service, average latency, error rate and throughput; sort to find the slowest.
- Service map: who calls whom, coloured by latency or errors.
- Traces: filterable list, then a Gantt chart of a trace's spans.
Spans are ordinary documents: you can query them directly.
source=otel-v1-apm-span-* | where status.code = 2 | stats count() as erreurs by serviceName, name | sort - erreurs | head 10

source=otel-v1-apm-span-* | where serviceName = 'paiement' | stats avg(durationInNanos) / 1000000 as ms_moyen by span(startTime, 5m)
Good to know :status.code = 2is the error status in OpenTelemetry. Field names depend on the Data Prepper version: check them withGET otel-v1-apm-span-*/_mapping.
3. Correlating #
From symptom to cause.
An investigation #
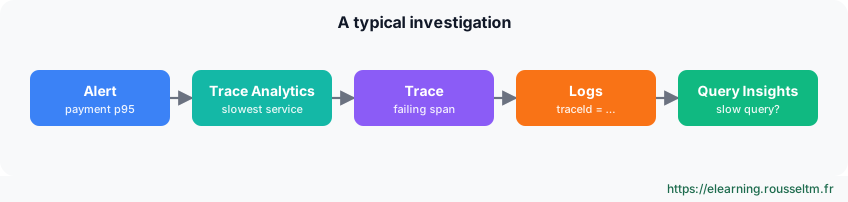
The key to correlation is the traceId: if it is written in every log line (OpenTelemetry SDKs do it automatically), you go from a slow trace to its logs in one click, or with a query.
source=otel-logs-* | where traceId = '4bf92f3577b34da6a3ce929d0e0e4736' | fields @timestamp, severityText, body | sort @timestampBest practice : Normalize service names everywhere (OpenTelemetry service.name): logs, traces and metrics then join without a mapping table.Prometheus metrics #
OpenSearch can query an existing Prometheus server as a data source, without copying metrics: you visualize them next to logs and traces.
POST _plugins/_query/_datasources
{
  "name": "prometheus_prod",
  "connector": "prometheus",
  "properties": {"prometheus.uri": "http://prometheus:9090"}
}
4. Query Insights #
The queries that cost the most.
Enabling and reading #
PUT _cluster/settings
{
  "persistent": {
    "search.insights.top_queries.latency.enabled": true,
    "search.insights.top_queries.latency.window_size": "10m",
    "search.insights.top_queries.latency.top_n_size": 10
  }
}

GET _insights/top_queries?type=latency
Query Insights ranks the slowest queries (or the most CPU- and memory-hungry, with type=cpu and type=memory) over a sliding window, with their shape, index and origin. It is the starting point for optimizing a slow dashboard.
Commands to know #
Commands to know
GET otel-v1-apm-span-*/_count: number of spans receivedGET _insights/top_queries?type=latency: slowest queriesPOST _plugins/_query/_datasources: declare a Prometheus sourcesource=otel-logs-* | where traceId = '…': logs of a trace
Sources #
Checked in November 2026 (OpenSearch 3.x, Data Prepper 2.x): OpenSearch ships a minor release about every six weeks, check the release notes before relying on a detail.