1. Sizing #
Shards, memory and disk.
Shard size #
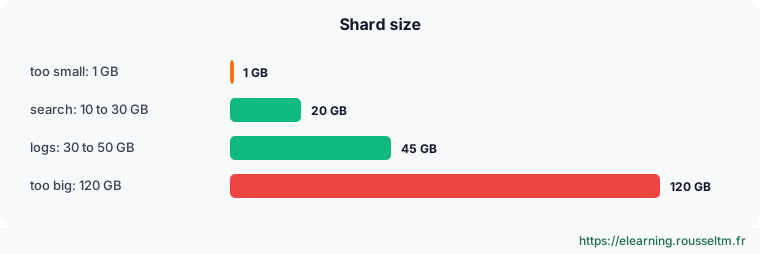
Aim for 10 to 50 GB shards. An example: 200 GB of logs per day, 30-day retention, 1 replica, i.e. 200 × 30 × 2 = 12 TB on disk. With 40 GB shards, the daily index takes 5 primaries (200 / 40) and the cluster holds 300 shards in total, reasonable for 6 data nodes with 2 TB usable each (keeping a 25% margin).
Good to know : Requests are written in the OpenSearch Dashboards Dev Tools console format (GET _cluster/health). On the command line, the same request iscurl -sk -u 'admin:Str0ng!Passw0rd-2026' https://localhost:9200/_cluster/health, with-H 'Content-Type: application/json' -d '…'when there is a body.
Guidelines #
| Resource | Guideline |
|---|---|
| JVM heap | 50% of RAM, 32 GB at most; the rest for the OS cache |
| Shards per node | at most 25 per GB of heap (775 for 31 GB), default limit 1,000 |
| Disk | SSD for hot data; stay below 75% usage |
| CPU | indexing and aggregations use the most |
2. Indexing fast #
Bulk, refresh and translog.
The levers #
| Lever | Setting | Effect |
|---|---|---|
| Bulk | 5 to 15 MB batches, several clients in parallel | fewer round trips |
| Refresh | index.refresh_interval: 30s | fewer small segments; data visible later |
| Initial load | refresh_interval: -1 and 0 replicas, then restore | 2 to 3 times faster |
| Translog | index.translog.durability: async | faster, risk of losing a few seconds |
| Compression | index.codec: zstd_no_dict | less disk, a bit more CPU |
| IDs | let OpenSearch generate them | avoids an existence check |
PUT logs-import/_settings
{"index": {"refresh_interval": "-1", "number_of_replicas": 0}}

# … chargement en bulk …

PUT logs-import/_settings
{"index": {"refresh_interval": "30s", "number_of_replicas": 1}}
POST logs-import/_forcemerge?max_num_segments=1
Common mistake : Watch write rejections: GET _cat/thread_pool/write?v&h=node_name,active,queue,rejected. Rising rejections mean the cluster no longer keeps up: slow clients down or add nodes, do not enlarge the queue.3. Hot, warm and searchable snapshots #
Paying less for old data.
Tiered architecture #
Give nodes an attribute (node.attr.temp: hot or warm), then let ISM move ageing indexes to warm nodes, on cheaper disks:
{"name": "tiede",
 "actions": [
   {"allocation": {"require": {"temp": "warm"}, "wait_for": true}},
   {"replica_count": {"number_of_replicas": 1}},
   {"force_merge": {"max_num_segments": 1}}
 ],
 "transitions": [{"state_name": "archive", "conditions": {"min_index_age": "30d"}}]}
Searchable snapshots #
An index restored with "storage_type": "remote_snapshot" stays in object storage: search role nodes only download the needed parts, with a local cache. Queries are slower, but storage costs that of an S3 bucket.
POST _snapshot/sauvegardes/logs-2026.09/_restore
{
  "indices": "logs-2026.09.*",
  "storage_type": "remote_snapshot",
  "rename_pattern": "(.+)",
  "rename_replacement": "archive-$1"
}
4. Protecting the cluster #
Disk and memory.
Disk watermarks #
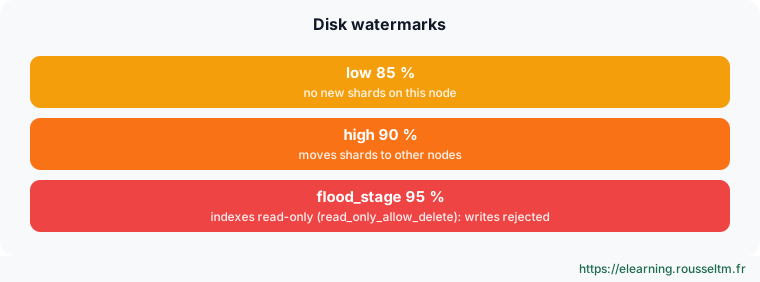
At the flood_stage watermark, the node's indexes become read-only. Once space is freed, OpenSearch lifts the block automatically; on older versions it had to be done by hand:
PUT logs-*/_settings
{"index.blocks.read_only_allow_delete": null}
Circuit breakers #
Circuit breakers reject a request rather than let the JVM run out of memory: a size-100,000 terms aggregation on a high-cardinality field triggers a circuit_breaking_exception. It is a protection, not a failure: reduce the query (composite, filters, shorter period).
GET _nodes/stats/breaker?filter_path=nodes.*.breakers.parent5. Troubleshooting #
A method, tools.
The method #
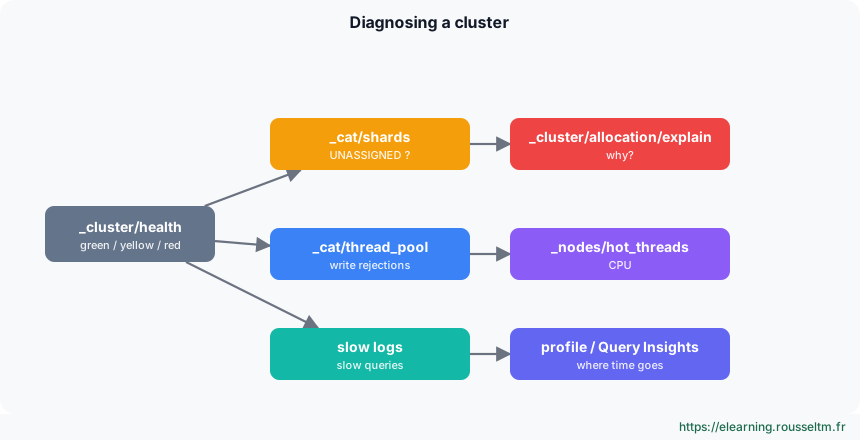
Slow queries #
PUT logs-app-*/_settings
{
  "index.search.slowlog.threshold.query.warn": "2s",
  "index.search.slowlog.threshold.query.info": "500ms",
  "index.indexing.slowlog.threshold.index.warn": "1s"
}

GET logs-app-*/_search
{"profile": true, "query": {"wildcard": {"message": "*timeout*"}}}
profile details the time spent by each part of the query and per shard. Here, a wildcard starting with * must scan every term: prefer an analyzed field and match.
Commands to know #
Commands to know
GET _cat/allocation?v: disk per nodeGET _cat/thread_pool/write,search?v&h=node_name,name,active,queue,rejected: queues and rejectionsGET _nodes/hot_threads: what keeps the CPU busyGET _cat/segments/<index>?v: an index's segmentsGET _nodes/stats/jvm,breaker: memory and circuit breakersGET _cat/indices?v&s=store.size:desc: largest indexes
Sources #
Checked in November 2026 (OpenSearch 3.x, Data Prepper 2.x): OpenSearch ships a minor release about every six weeks, check the release notes before relying on a detail.