1. The Problems app #
One problem, not a thousand alerts.
Principle #
| Category | Example |
|---|---|
| Availability | Process stopped, host unreachable |
| Error | Rising failure rate of a service |
| Slowdown | Degraded response time |
| Resource | CPU, memory, disk saturation |
| Custom | User-defined alert (threshold, event) |
2. Reading a problem page #
The key information.
Content #
- Impact: affected users, applications and services.
- Root cause: the entity and event identified by Davis, with the evidence (metrics, changes, deployments).
- Timeline of related events.
- Visual resolution path: how the problem propagated through the topology.
- Comments and integrations (ticket created, notification sent).
Good practice: Before looking further, check the deployment and configuration events in the timeline: a large share of incidents follow a change.
3. Notifications and automation #
Notifying and acting.
Alerting profiles and integrations #
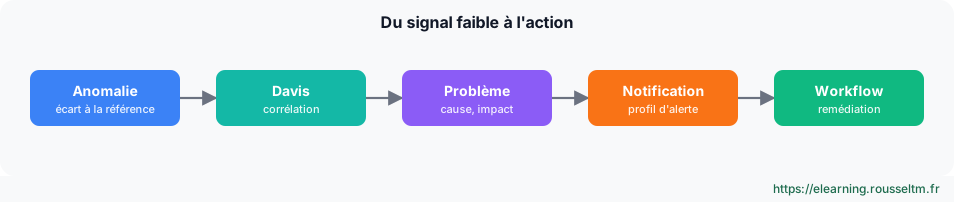
An alerting profile filters problems (severity, management zone or segment, tags, minimum duration); a notification links it to a channel: email, Slack, Microsoft Teams, webhook, PagerDuty, ServiceNow, Jira...
Workflows and auto-remediation #
Workflows (AutomationEngine) are triggered by a problem, an event or a schedule and chain actions: DQL query, HTTP call, ticket creation, running a runbook (Ansible, script), message.
Déclencheur : Davis problem (catégorie Ressource, tag service:checkout)
Tâche 1 : requête DQL - récupérer les logs d'erreur des 10 dernières minutes
Tâche 2 : HTTP request - appeler le job « redémarrer le pod » de l'outil d'automatisation
Tâche 3 : Slack - publier le résumé et le lien vers le problème
Common mistake: Limit auto-remediation to safe, reversible actions (restart, cache purge, scale-up) and log every run.
Mobile app #
The Dynatrace mobile app (iOS, Android) sends push notifications for problems and lets you view impact and root cause from a phone, handy for on-call.
